
The nine advertising KPIs every CEO must track, in priority order: Customer Acquisition Cost (CAC), CAC Payback Period, Lifetime Value (LTV), LTV:CAC Ratio, Return on Ad Spend (ROAS), Return on Investment (ROI), Cost Per Acquisition (CPA), Conversion Rate, and Marketing-Sourced Revenue. This week, lock your payback horizon with your CFO, assign an owner to each metric, and confirm your team reports all nine in one shared dashboard before the next budget review.
- CAC — Total spend divided by new customers acquired. Ask: "Is our cost to acquire a customer trending up or down?" Owner: Marketing + Finance. Weekly.
- CAC Payback Period — Months to recover CAC from gross margin. Ask: "How long before we break even on a new customer?" Owner: Finance. Monthly.
- LTV — Projected revenue per customer over their lifetime. Ask: "Are we acquiring customers worth keeping?" Owner: Marketing + Product. Quarterly.
- LTV:CAC Ratio — LTV divided by CAC. Ask: "Are we getting at least 3x back for every dollar we spend to acquire?" Owner: Finance. Monthly.
- ROAS — Revenue generated per dollar of ad spend. Ask: "Which channels are pulling their weight?" Owner: Marketing. Weekly.
- ROI — Net profit from advertising divided by total investment. Ask: "Is advertising profitable after all costs?" Owner: Finance. Monthly.
- CPA — Total spend divided by conversions. Ask: "What does each lead or sale actually cost us?" Owner: Marketing. Weekly.
- Conversion Rate — Conversions divided by total clicks or sessions. Ask: "Is our traffic converting, or are we buying clicks that go nowhere?" Owner: Marketing. Weekly.
- Marketing-Sourced Revenue — Revenue directly attributed to marketing campaigns, reconciled with CRM. Ask: "How much of our revenue did marketing actually generate?" Owner: Marketing + Sales. Monthly.
Key Takeaways
The most effective CEO advertising KPI system locks nine metrics to specific owners and payback horizons before any campaign budget is approved, then reviews them on a weekly and monthly cadence tied to business goals.
| Point | Details |
|---|---|
| Lock metrics before launch | Agree on CAC, ROAS, ROI definitions and payback horizon with finance before approving any budget. |
| Use LTV:CAC as your north star | A ratio below 3:1 signals unsustainable growth; review it monthly and flag it at board level. |
| Normalize ROAS by gross margin | Platform ROAS without margin context can make a money-losing campaign look profitable. |
| Build a 5-minute executive dashboard | Weekly: CAC trend, top 3 channel ROAS, marketing-sourced revenue. Monthly: LTV:CAC, payback period, pipeline contribution. |
| Atdigiagency as your next step | Atdigiagency's performance marketing team implements this checklist with shared dashboards and finance-aligned reporting from day one. |
Table of Contents
- What do the core advertising KPIs mean, and who owns each one?
- Which KPIs should you track by advertising channel?
- How do you match KPIs to your business goal and funnel stage?
- What is the difference between ROAS and ROI, and why does attribution matter?
- What benchmarks should you use, and when should you change your targets?
- What should your executive dashboard include each week and month?
- Which metrics are vanity, and which red flags demand your attention?
- How do you align marketing and finance on KPIs before a campaign launches?
- How we use this checklist with CEO clients
- Ready to map your KPIs to a real campaign plan?
- Sources
What do the core advertising KPIs mean, and who owns each one?
Formulas matter. Without them, "we improved CAC" is a claim, not a fact. Below are the nine KPIs from the checklist, each with its exact formula, a one-line business case, and the owner and cadence your team should follow.
| KPI | Formula | Business Impact | Owner | Cadence |
|---|---|---|---|---|
| CAC | Total Ad Spend ÷ New Customers Acquired | Tells you the price of growth; rising CAC without rising LTV is a warning sign | Marketing + Finance | Weekly |
| CAC Payback Period | CAC ÷ (Avg. Monthly Revenue per Customer × Gross Margin %) | Shows how long capital is tied up before a customer becomes profitable | Finance | Monthly |
| LTV | Avg. Order Value × Purchase Frequency × Avg. Customer Lifespan | Anchors every spend decision to long-term customer value | Marketing + Product | Quarterly |
| LTV:CAC Ratio | LTV ÷ CAC | A ratio below 3:1 signals unsustainable growth; above 5:1 may mean underinvestment | Finance | Monthly |
| ROAS | Revenue from Ads ÷ Ad Spend | Channel-level efficiency signal; use it to allocate budget across campaigns | Marketing | Weekly |
| ROI | (Net Profit from Ads − Ad Investment) ÷ Ad Investment × 100 | Business-level profitability after margin, overhead, and fulfillment costs | Finance | Monthly |
| CPA | Total Spend ÷ Total Conversions | Tracks cost per desired action; compare against LTV to confirm margin viability | Marketing | Weekly |
| Conversion Rate | Conversions ÷ Total Clicks (or Sessions) × 100 | Separates traffic quality from volume; a falling rate with flat spend signals a creative or landing page problem | Marketing | Weekly |
| Marketing-Sourced Revenue | CRM-reconciled revenue from marketing-attributed deals | Connects ad spend to the revenue line finance actually cares about | Marketing + Sales | Monthly |
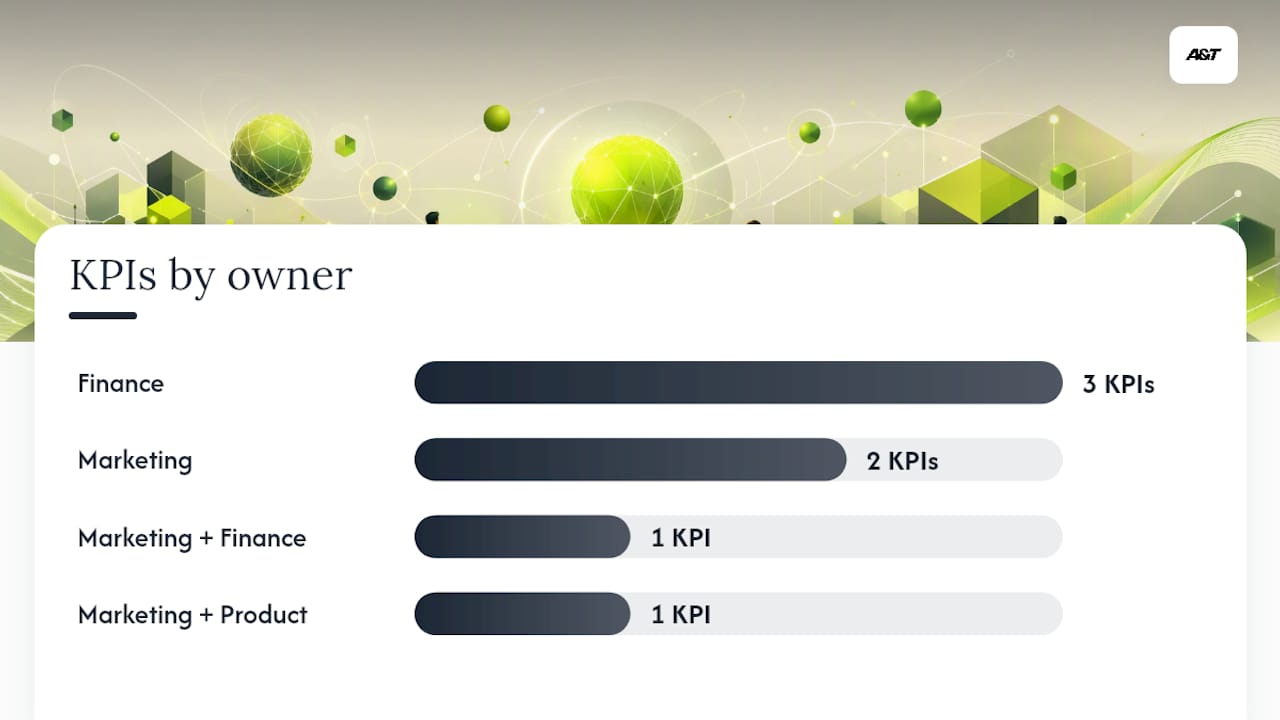
A few notes on using this table. CAC and CPA are related but not identical: CPA measures cost per conversion event (a form fill, a purchase, a trial signup), while CAC counts only net-new customers. You can have a low CPA and a high CAC if your conversion-to-customer rate is poor. Track both.
LTV:CAC is the ratio that most directly tells you whether your advertising model is structurally sound. A 3:1 ratio is a widely cited floor for sustainable growth, but the right target depends on your payback horizon and gross margin.
For measuring campaign results accurately, reconcile marketing-sourced revenue against your CRM every month. Platform-reported revenue and CRM-recorded revenue rarely match exactly, and the gap is where budget decisions go wrong.
Which KPIs should you track by advertising channel?
Not every metric applies equally across channels. A CEO reading a paid search report and a paid social report should know which numbers signal a real problem versus normal channel behavior.
Paid search (Google Ads, Microsoft Ads)
- CPC (Cost Per Click): Rising CPC without a corresponding lift in conversion rate means you're paying more for the same result. Investigate bid strategy and Quality Score.
- CTR (Click-Through Rate): A low CTR on branded terms is a red flag; on non-branded terms, it signals weak ad copy or poor keyword match.
- Conversion Rate: The most decision-useful metric in search. A drop here usually points to a landing page problem, not an ad problem.
- Revenue Per Click: Total revenue divided by total clicks. This is the number that ties search performance directly to your top line.
Paid social (Meta, TikTok, LinkedIn)
- CPM (Cost Per Thousand Impressions): Tracks auction competitiveness. A rising CPM with flat results means the channel is getting more expensive, not more effective.
- CTR: On social, CTR reflects creative quality more than audience quality. A falling CTR is a creative fatigue signal.
- CPA: The primary efficiency metric for direct-response social campaigns. Compare it against your target CPA derived from LTV and margin.
- ROAS: Use platform-reported ROAS as a directional signal, not a final answer. Always reconcile against CRM data.
Display, video, and CTV
- View-Through Conversion Rate: Measures conversions that occurred after an ad was seen but not clicked. Useful for upper-funnel awareness campaigns, but treat it with skepticism unless you've run an incrementality test.
- Reach and Frequency: Ensures your budget is building genuine awareness, not hammering the same audience repeatedly.
- Engagement Lift: For video, track completion rate and brand recall lift (via brand lift studies) rather than raw impressions.
| Channel | Primary KPI | CEO Interpretation |
|---|---|---|
| Paid Search | Conversion Rate + Revenue Per Click | Falling conversion rate = landing page or offer problem, not a media problem |
| Paid Social | CPA + ROAS | Rising CPA with flat ROAS = creative fatigue; refresh creative before cutting budget |
| Display / Video | Reach Efficiency + View-Through Rate | High reach with low downstream conversion = awareness gap, not a channel failure |
| CTV | Engagement Lift + Incremental Reach | Use for brand measurement, not direct-response attribution |
| Retargeting | CPA + Conversion Rate | Retargeting CPA should be materially lower than prospecting CPA; if not, audience overlap is the problem |
Pro Tip: For a digital advertising checklist that maps channel KPIs to launch and optimization steps, use a standardized template across all channels so your team reports in the same format every week. Cross-channel comparisons only work when the definitions are identical.
How do you match KPIs to your business goal and funnel stage?
The right KPI depends on what you're trying to accomplish this quarter. Tracking LTV:CAC during a short-term revenue push wastes attention. Optimizing for CPA during a brand-building phase misreads the goal entirely.
| Business Goal | Funnel Stage | Lead KPI(s) | Decision Rule |
|---|---|---|---|
| Short-term revenue growth | Bottom of funnel | CPA, Conversion Rate | If CPA exceeds target by 20%+, pause and reallocate promptly |
| Profitability | Full funnel | ROI, CAC Payback Period | If payback exceeds agreed horizon, freeze new spend until margin is restored |
| Scale / market share | Top + mid funnel | CAC trend, Marketing-Sourced Revenue | If CAC rises but LTV holds, scaling is still viable; if both move against you, stop |
| Customer retention | Post-purchase | LTV, Repeat Purchase Rate | Declining LTV signals a retention problem, not an acquisition problem |
| Brand awareness | Top of funnel | Reach Efficiency, Engagement Lift | Use brand lift studies quarterly; do not optimize brand spend on CPA |

The decision rules in the table are the part most CEOs skip. Without a pre-agreed trigger, every KPI movement becomes a debate. Set the thresholds before the campaign launches, not after results disappoint.
Review efficiency KPIs (CPA, ROAS, Conversion Rate) weekly. Review pipeline and LTV metrics monthly. Review brand and retention metrics quarterly. That cadence matches the speed at which each metric actually changes and prevents over-reacting to short-term noise.
What is the difference between ROAS and ROI, and why does attribution matter?
Use ROAS to evaluate channel efficiency. Use ROI to make investment decisions. Use incremental revenue to prove that advertising actually caused growth.
ROAS tells you how much revenue a channel generated per dollar spent. It says nothing about profit. Always normalize ROAS by gross margin before drawing conclusions.
ROI accounts for all costs, including creative, agency fees, and fulfillment, and expresses the result as a profit percentage. It's the number your CFO cares about. The formula: (Net Profit from Ads − Ad Investment) ÷ Ad Investment × 100.
Attribution models and their trade-offs
- Last-click: Gives 100% credit to the final touchpoint before conversion. Simple, but systematically undervalues upper-funnel channels like display and video.
- First-click: Gives 100% credit to the first touchpoint. Useful for understanding what drives awareness, but ignores everything that closes the sale.
- Multi-touch (linear or time-decay): Distributes credit across touchpoints. More accurate, but harder to act on without a clean data pipeline.
- Algorithmic / data-driven: Uses machine learning to assign credit based on actual conversion paths. The most accurate model available in Google Ads and Meta, but requires sufficient conversion volume to train reliably.
For most SMBs, a data-driven attribution model inside Google Ads or Meta is the right starting point. The key is consistency: pick one model, apply it across all channels, and don't switch mid-campaign without documenting the change.
Incrementality: the question attribution can't answer
Attribution tells you which channel got credit. Incrementality tells you whether the campaign actually caused the conversion or whether the customer would have bought anyway. The gap between those two answers is where ad budgets get wasted.
Practical incrementality approaches your team can run:
- Holdout tests: Withhold ads from a randomly selected audience segment and compare conversion rates against the exposed group.
- Geo experiments: Run campaigns in selected markets and compare against matched control markets.
- Platform incrementality tools: Meta's Conversion Lift and Google's Incrementality Measurement suite both offer structured tests within the platforms.
Require at least one incrementality test per quarter on your highest-spend channel. The result will either validate your ROAS numbers or reveal that you've been over-crediting a channel that was riding organic demand.
Pro Tip: *Ask your marketing team to present a "margin-normalized ROAS" figure alongside standard ROAS in every weekly report. The formula: (Revenue from Ads × Gross Margin %) ÷ Ad Spend.
What benchmarks should you use, and when should you change your targets?
External benchmarks are a starting point, not a standard. Industry averages for ROAS, CAC, and conversion rates vary widely by vertical, price point, and competitive intensity. A benchmark from a B2C e-commerce report tells a B2B SaaS CEO almost nothing useful.
The most reliable benchmarks come from your own historical data, segmented by cohort. Your CAC from 12 months ago, adjusted for seasonality and channel mix, is a more honest baseline than any industry report. Use external data to sanity-check your numbers, not to set targets.
That said, a few directional ranges are worth knowing:
- LTV:CAC: A ratio of 3:1 is the widely cited floor for sustainable growth. Below 2:1 signals structural problems with either acquisition cost or retention.
- CAC Payback Period: Consumer businesses typically target 6–12 months; B2B SaaS companies often accept 12–18 months given higher LTV.
- ROAS: Varies enormously by channel and margin. A 2x ROAS on a 60% gross margin product is profitable; a 4x ROAS on a 15% margin product is not.
How to set targets that hold up under scrutiny
- Start with your baseline: Calculate the last 90 days of actual performance for each KPI, segmented by channel and campaign type.
- Apply a margin constraint: Every target must be viable at your current gross margin. A CPA target that only works at 80% margin is not a real target for a business running at 40%.
- Set a payback constraint: Agree with finance on the maximum acceptable CAC payback period before the campaign launches. This is the single most important number to lock.
- Build a sensitivity band: Define the range within which a KPI can move before it triggers a review (for example, CPA within ±15% of target is normal variance; beyond that, investigate).
- Review targets quarterly: Markets shift, competition changes, and creative cycles end. A target set in January may be wrong by April.
Analytics in advertising can materially improve target accuracy by surfacing cohort-level trends that aggregate reporting hides. Analytics-driven campaigns tend to show meaningfully better ROI than those relying on platform-reported averages alone.
Statistic: Gartner reports that roughly 52% of senior marketing leaders can credibly prove marketing's value to the business. That means nearly half of marketing teams are setting targets they cannot defend. Agreed definitions and shared measurement, locked before launch, close that gap.
When a KPI misses its target, the first question is not "should we change the target?" It's "do we understand why it missed?" A rising CPA caused by a platform algorithm change requires a different response than one caused by a landing page conversion drop. Investigate the operational cause before adjusting the target, or you'll mask a real problem with a softer number.
What should your executive dashboard include each week and month?
Executive dashboards should start with revenue and work backward to the marketing activity that drove it. A CEO should be able to complete a performance review in five minutes. If the dashboard requires ten minutes of explanation before the numbers make sense, it's built for the marketing team, not for you.
Weekly snapshot
- Top-line revenue trend: Total revenue this week versus the same week last month and last year.
- Marketing-sourced revenue: Revenue attributed to marketing campaigns, reconciled with CRM. Show the sourced, influenced, and associated splits separately.
- CAC trend: Current CAC versus the 30-day and 90-day average. A single week's spike is noise; a three-week trend is a signal.
- Top 3 channel ROAS: The three highest-spend channels, each showing spend, revenue, and ROAS. No more than three; anything beyond that belongs in the channel report, not the executive view.
- Anomaly flags: Any metric that moved more than 20% week-over-week, with a one-line explanation from the marketing lead.
Monthly strategic panel
- LTV:CAC ratio: Current ratio versus the prior quarter. Flag if it drops below 3:1.
- CAC Payback Period: Current payback in months versus the agreed target. Flag if it exceeds the locked horizon.
- Pipeline contribution: Marketing-sourced pipeline as a percentage of total sales pipeline. This is the number that connects advertising to the revenue forecast.
- Brand momentum indicators: For businesses running brand campaigns, include search volume trends for branded terms and any brand lift study results from the quarter.
Alert thresholds that trigger executive action
- CPA rises more than 25% above target for two consecutive weeks: escalate to marketing lead for root cause analysis.
- Marketing-sourced revenue drops more than 15% month-over-month without a corresponding drop in spend: investigate attribution and CRM reconciliation.
- LTV:CAC falls below 2.5:1: freeze new channel expansion until the ratio recovers.
- CAC payback exceeds the agreed horizon by more than 20%: require a written plan from marketing within five business days.
Effective executive reporting answers four questions in sequence: what happened, why it happened, why it matters, and what the team will do next. Every weekly and monthly report your marketing team sends should follow that structure. If it doesn't, send it back.
Which metrics are vanity, and which red flags demand your attention?
Vanity metrics feel good in a slide deck and mean almost nothing for decisions. The most common ones in advertising reports:
- Impressions: Volume of ad views with no connection to revenue or conversion. Relevant for reach planning, not for performance evaluation.
- Raw follower counts: Social audience size has no direct relationship to revenue unless you can show a conversion path from follower to customer.
- Click volume without conversion context: A million clicks at a 0.1% conversion rate is worse than 10,000 clicks at a 5% conversion rate.
- Unqualified leads: Lead volume without a qualification rate attached is a number that flatters the marketing team and misleads the CEO.
Red flags that require immediate investigation
- Rising CAC with flat or declining LTV: The acquisition model is breaking down. Either the channel is saturating, the creative is fatiguing, or you're reaching a lower-quality audience.
- Sudden conversion lift without channel changes: Unexplained spikes often indicate attribution errors, pixel misfires, or bot traffic. Verify with CRM data before celebrating.
- Data source inconsistencies: Platform-reported conversions that are significantly higher than CRM-recorded deals signal a measurement problem. The gap between Google Ads conversions and actual closed revenue should be explainable.
- Flat ROAS with rising spend: Scaling spend without scaling results means you've hit diminishing returns on the current audience or creative. Stop scaling until the root cause is identified.
Converting vanity signals into useful metrics
- Impressions → Brand lift study results + downstream funnel conversion rate from exposed audiences.
- Follower growth → Follower-to-lead conversion rate + revenue attributed to social-sourced leads.
- Click volume → Revenue per click + conversion rate by traffic source.
- Lead volume → Qualified lead rate + CPA on qualified leads only.
The ad optimization checklist your team uses week-to-week should include a step that flags any metric reported without a corresponding business outcome. If the metric can't be connected to revenue, retention, or margin, it doesn't belong in an executive report.
How do you align marketing and finance on KPIs before a campaign launches?
Lock the metrics before you approve the budget. That's the short answer, and it's the one most CEOs skip.
Bain's analysis of the marketing–finance relationship found that companies with strong CMO–CFO alignment are almost 1.5 times more likely to be leaders in their sector. The three practices that distinguish leaders from laggards: radical transparency of assumptions and data, locking metrics and definitions before launch, and agreeing on payback expectations before budgets are approved.
Statistic: Companies that lock metrics, share transparent data, and agree payback expectations with finance materially outperform peers in revenue growth. The Bain/Google Leaders and Laggards Survey (n=1,397) identifies these three practices as the clearest differentiators between marketing leaders and the rest.
High-performing companies earn the freedom to invest in longer-term brand campaigns by consistently delivering short-term, measurable results and presenting them transparently to finance. That trust is built metric by metric, quarter by quarter.
The pre-launch alignment checklist
- Define every metric in writing: CAC, ROAS, and conversion rate must have agreed definitions before the campaign starts. "Conversion" means different things to marketing and finance unless you write it down.
- Agree on attribution rules: Which model, which window, and which data source. Document it and share it with both teams.
- Lock the payback horizon: Finance approves a budget based on an expected payback period. That number must be explicit, not implied.
- Share raw data access: Finance should have read access to the same dashboards marketing uses. No filtered views, no summary-only reports.
- Schedule joint reviews: A monthly 30-minute review between marketing and finance, using the same dashboard, eliminates most of the "our numbers say X, your numbers say Y" arguments.
- Publish a reconciliation report: Every month, marketing publishes a one-page reconciliation showing platform-reported revenue versus CRM-recorded revenue, with an explanation of the gap.
The Google Ads benefits for CEOs framework shows how a structured reporting approach, with shared dashboards and agreed attribution, turns advertising data into a number the CFO can use in a board presentation. That's the standard to aim for.
How we use this checklist with CEO clients
We run this checklist with every new CEO client in the first two weeks of an engagement. Not as a formality. As a diagnostic.
The most common finding: the marketing team is tracking 20 metrics, the CEO is seeing 5 of them in a monthly slide deck, and finance is working from a completely different set of numbers. Nobody is lying. They're just measuring different things with different definitions, and the gap is costing the business real money in misallocated budget.
The first thing we do is reduce the dashboard to the nine KPIs in this checklist, assign a single owner to each, and set the alert thresholds. Within 30 days, most clients report that their weekly review takes half the time it used to and produces twice as many clear decisions. CAC payback clarity alone typically changes how CEOs think about channel investment, because for the first time they can see exactly how long their capital is tied up before a new customer becomes profitable.
When CEOs use this checklist during board preparation, it reframes the conversation. Instead of defending a marketing budget, they're presenting a structured investment case with a defined payback horizon, a margin-normalized ROAS, and a marketing-sourced revenue figure reconciled with the CRM. That's a different conversation entirely.
Ready to map your KPIs to a real campaign plan?
Most SMB CEOs we talk to have the data. What they're missing is a structured system that connects that data to decisions. Atdigiagency's performance marketing team builds and manages paid advertising systems across Google Ads, Meta, and TikTok, with reporting designed specifically for executive review.
A 30-minute diagnostic call maps your current KPIs against the checklist, identifies the gaps, and gives you a clear picture of where your ad spend is working and where it isn't. No long onboarding, no unnecessary meetings.
- We've helped clients in telehealth, retail, and entertainment reduce CAC payback periods and improve marketing-sourced revenue attribution.
- Our reporting framework aligns with finance from day one: agreed definitions, shared dashboards, and monthly reconciliation reports.
- The next step is simple: book a diagnostic call and we'll show you exactly what your dashboard should look like.
Sources
- The marketing–finance divide is about proof of performance, not priorities — Bain & Company
- Gartner press release: survey finds only 52% of senior marketing leaders can prove marketing's value
- Kpi
- Executive marketing reporting: What executives care about - Meltwater