
Marketing teams now analyze over twice the amount of data per query compared to five years ago, yet more than half lack sufficient time or tools to analyze it well. For marketing managers at small to medium-sized businesses, this explosion of data creates a paradox: more information should mean better decisions, but without effective reporting frameworks, it often leads to confusion and missed opportunities. Mastering marketing reporting transforms this data overload into actionable insights that drive strategy optimization and measurable ROI improvements.
Table of Contents
- Understanding Marketing Reporting: Definition And Purpose
- Key Components And Metrics In Marketing Reporting
- Challenges And Common Misconceptions In Marketing Reporting
- Frameworks And Structuring Effective Marketing Reports
- How Marketing Reporting Drives ROI And Campaign Optimization
- Best Practices: Reporting Frequency, Customization, And Avoiding Pitfalls
- Case Studies: SMB Success Through Effective Marketing Reporting
- Enhance Your Marketing Impact With Expert Reporting Support
- Frequently Asked Questions
Key takeaways
| Point | Details |
|---|---|
| Marketing reporting converts data into actionable insights | Structured reporting consolidates multi-source campaign data to guide smarter budget allocation and strategic decisions. |
| Essential components include clear goals and stakeholder-focused KPIs | Reports must feature executive summaries, relevant metrics like conversion rates and ROI, and tailored insights for different stakeholder roles. |
| Common misconceptions undermine reporting effectiveness | More data doesn't automatically improve decisions without defined goals; misaligned report frequency reduces agility and responsiveness. |
| Frameworks aligned to stakeholders improve clarity | Segmenting reports by campaign, channel, and audience increases relevance and supports actionable decision-making. |
| Effective reporting drives measurable ROI improvement | Data-driven reporting enables ongoing campaign optimization, smarter spending, and documented performance gains. |
Understanding marketing reporting: definition and purpose
Marketing reporting is the structured process of tracking, analyzing, and communicating marketing campaign performance to optimize spending and guide strategic decision-making. This systematic approach consolidates data from multiple channels like Google Ads, Meta campaigns, email platforms, and website analytics into coherent narratives that reveal what's working and what needs adjustment. The core purpose extends beyond simple data collection to enable actionable insights that support budget allocation decisions, identify campaign improvement opportunities, and provide evidence-based justification for marketing strategies.
For SMB marketing managers juggling limited resources and competing priorities, effective reporting transforms raw marketing data into understandable, relevant information. Rather than drowning in spreadsheets filled with metrics that tell incomplete stories, structured reports highlight patterns, anomalies, and trends that matter for business growth. This transformation supports critical evaluation of strategy effectiveness across channels and campaigns.
Marketing reporting serves multiple stakeholder needs simultaneously. Executives need high-level ROI summaries to evaluate marketing investment returns. Marketing managers require granular performance data to adjust tactics and optimize campaigns in real time. The reporting framework must balance these competing needs while maintaining clarity and actionability.
Key purposes of marketing reporting include:
- Tracking campaign performance against predefined goals and benchmarks
- Identifying which channels and tactics generate the highest return on ad spend
- Supporting data-driven budget reallocation decisions across campaigns
- Providing transparency and accountability for marketing investments
- Enabling rapid response to underperforming campaigns or emerging opportunities
Without structured reporting, marketing decisions become reactive guesswork rather than strategic responses to verified performance data. The difference between businesses that scale efficiently and those that waste ad spend often comes down to reporting discipline and framework implementation.
Key components and metrics in marketing reporting
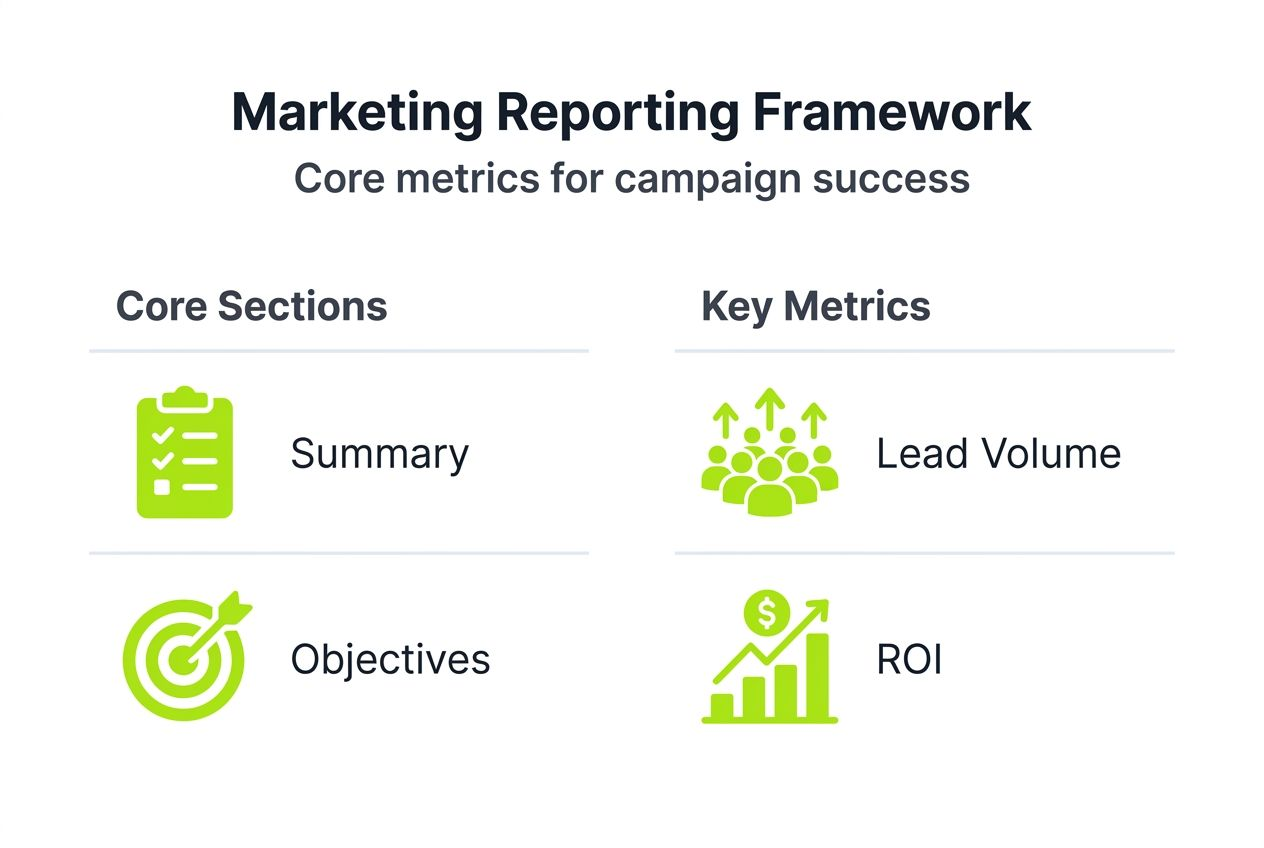
Core components essential in marketing reports include an executive summary, clearly defined goals and objectives, relevant metrics and KPIs, and actionable analysis and insights. The executive summary provides a snapshot of overall performance, highlighting wins, challenges, and key trends in language accessible to non-technical stakeholders. This section answers the fundamental question: are we moving toward or away from our marketing objectives?

Goals and objectives establish the framework for evaluating all other metrics. Without clear goals, even accurate data becomes meaningless noise. Effective reports state objectives explicitly, such as increasing qualified leads by 20% or achieving a target cost per acquisition below $50. These benchmarks transform abstract numbers into meaningful performance indicators.
Relevant KPIs vary by business model, campaign type, and stakeholder needs. Lead generation campaigns focus on metrics like cost per lead, lead quality scores, and conversion rates from lead to customer. E-commerce campaigns prioritize return on ad spend, average order value, and customer acquisition cost. Understanding performance marketing terminology and ROI ensures reports use consistent, meaningful metrics.
Different stakeholders require tailored metric presentations. CMOs typically need strategic overviews focusing on overall ROI, market share changes, and brand health indicators. Marketing managers need operational details showing campaign-level performance, channel effectiveness, and tactical optimization opportunities. The best reports segment insights by audience to maximize relevance and engagement.
| Stakeholder | Primary Metrics | Report Focus | Frequency |
|---|---|---|---|
| CMO/Executive | Overall ROI, revenue growth, market share | Strategic performance and investment justification | Monthly/Quarterly |
| Marketing Manager | Campaign ROI, cost per lead, conversion rates | Tactical optimization and channel performance | Weekly/Bi-weekly |
| Finance Team | Marketing spend, cost per acquisition, revenue attribution | Budget tracking and financial accountability | Monthly |
| Sales Team | Lead volume, lead quality scores, conversion funnel metrics | Lead generation effectiveness and pipeline health | Weekly |
Knowing how to track ad performance metrics enables accurate reporting that drives meaningful conversations about strategy and resource allocation. The metrics you choose to highlight shape how stakeholders perceive marketing value and guide their decisions about future investments.
Challenges and common misconceptions in marketing reporting
Data overload without actionable frameworks creates decision paralysis rather than empowerment. Marketing managers face an avalanche of metrics from Google Analytics, ad platforms, CRM systems, and social media dashboards. Without clear prioritization and interpretation guidelines, this abundance leads to analysis paralysis where teams spend more time gathering data than acting on insights.
A pervasive misconception holds that more marketing data automatically means better decisions. The reality proves more nuanced. 56% of marketers lack sufficient time to properly analyze their marketing data; more data doesn't automatically improve decision quality without defined goals and interpretation. Volume without context obscures rather than illuminates, burying critical signals in noise.
Time constraints prevent deep data analysis for many marketers juggling campaign execution, creative development, and stakeholder communication. The pressure to demonstrate ROI competes with the time required to conduct thorough analysis. This squeeze often results in superficial reporting that checks boxes without driving meaningful insights or strategic adjustments.
"The challenge isn't accessing data; it's knowing which data matters for your specific business goals and having frameworks to interpret it quickly. Too many marketers collect everything and analyze nothing effectively."
Clear goal setting and data interpretation are critical to turn data into insights. Without predetermined success criteria, reports become descriptive rather than prescriptive. They tell you what happened but not what to do next. Effective reporting connects past performance to future action through analysis that identifies patterns, tests hypotheses, and recommends specific optimizations.
Common reporting pitfalls include:
- Tracking vanity metrics like impressions or likes instead of business outcomes
- Generating reports that nobody reads or acts upon
- Failing to connect marketing metrics to revenue and business growth
- Using inconsistent measurement periods that prevent meaningful comparisons
- Overwhelming stakeholders with raw data dumps rather than synthesized insights
Overcoming these challenges requires discipline in defining what success looks like before campaigns launch, establishing reporting cadences aligned with decision cycles, and committing to analysis that drives action rather than just documentation. The 2025 marketing data report highlights that successful marketing teams distinguish themselves through framework discipline, not just data access.
Frameworks and structuring effective marketing reports
Reports segmented by campaign, channel, and audience increase clarity and align insights with stakeholder roles like CMOs and marketing managers. This segmentation transforms generic performance summaries into targeted intelligence that addresses specific decision needs. Campaign segmentation reveals which initiatives deliver results and which drain resources. Channel segmentation identifies where to double down investment and where to pull back. Audience segmentation shows which customer segments respond best to different messaging and offers.
Tailoring content to stakeholder roles addresses specific decision needs and maximizes report utility. Executives need summaries that answer whether marketing investments deliver acceptable returns. Marketing managers need operational details showing where to optimize tactics. Sales teams need lead quality and volume data. Finance teams need spend tracking and attribution models. A single report rarely serves all audiences well, so consider creating role-specific views from a common data foundation.
Visual dashboards combined with narratives explain trends and insights more effectively than numbers alone. Charts and graphs enable pattern recognition at a glance, while narrative explanations provide context about why performance changed and what actions to take. The combination leverages human strengths in visual processing and storytelling comprehension. Comparing performance marketing software can help identify tools that support both visualization and narrative reporting.
Steps to structure an effective marketing report:
- Define clear objectives and success metrics before data collection begins
- Organize data by relevant segments like campaign, channel, time period, and audience
- Create visual representations of key trends and performance indicators
- Write narrative analysis explaining what the data reveals and why it matters
- Provide specific, actionable recommendations based on performance insights
- Include executive summary for quick consumption by time-constrained stakeholders
- Ensure consistent formatting and measurement periods for valid comparisons
Pro Tip: Balance detail with clarity by following the inverted pyramid approach. Start with the most important insights and recommendations, then provide supporting details for those who need deeper understanding. This structure ensures busy stakeholders get value even if they only read the first section.
The marketing reporting comprehensive guide emphasizes that framework consistency matters as much as the specific framework chosen. Teams that apply the same structure repeatedly develop institutional knowledge and comparative benchmarks that enhance insight quality over time.
How marketing reporting drives ROI and campaign optimization
Actionable reporting leads to smarter budget allocation and higher ROI by revealing which investments generate returns and which waste resources. When reports clearly show that Google Search campaigns deliver leads at $40 while display campaigns cost $120 per lead, the reallocation decision becomes obvious. Without reporting discipline, budgets often follow inertia or gut feeling rather than performance evidence.
Reporting supports ongoing, data-driven campaign optimizations by identifying underperforming elements that need adjustment. Perhaps ads targeting one demographic convert poorly while another segment shows strong engagement. Maybe certain ad creative variations drive clicks but not conversions. Regular reporting surfaces these patterns early enough to make corrective adjustments before budgets drain on ineffective tactics.
Clear reporting enables smarter marketing spend and improved ROI; an SMB improved lead generation by 15% through data-driven campaign adjustments. This example illustrates how systematic performance tracking combined with willingness to optimize based on evidence creates measurable improvements. The business identified that their social media campaigns generated high engagement but low conversion, while search campaigns showed inverse patterns. Reallocating budget toward search and refining social targeting based on engagement data produced the documented improvement.
"ROI improvement doesn't come from having data. It comes from acting on insights that data reveals. Reporting creates accountability that transforms insights into action."
Ways marketing reporting impacts outcomes:
- Identifies high-performing channels worthy of increased investment
- Reveals underperforming tactics that should be paused or redesigned
- Shows which audience segments respond best to different messaging strategies
- Tracks campaign performance trends over time to spot emerging patterns
- Provides evidence for strategic decisions about market expansion or channel focus
- Creates benchmarks for evaluating new campaign performance against historical data
The performance marketing guide demonstrates how systematic testing and measurement create competitive advantages. Businesses that report consistently, analyze honestly, and optimize aggressively pull ahead of competitors who rely on intuition or avoid measurement due to fear of negative findings.
Best practices: reporting frequency, customization, and avoiding pitfalls
Marketing reports are most effective when frequency aligns with decision-making needs, typically weekly or monthly; misalignment leads to reduced agility. Weekly reporting suits fast-moving campaigns where rapid optimization opportunities exist, such as paid search or social media advertising. Monthly reporting works better for strategic overview and campaigns with longer conversion cycles like content marketing or brand awareness initiatives.
Customizing reports by stakeholder maximizes relevance and engagement. CMOs don't need daily ad performance data, while campaign managers can't wait for monthly summaries to optimize underperforming ads. Tailor both content and delivery frequency to match how different roles use reporting insights. This customization demonstrates respect for stakeholders' time and increases the likelihood they'll actually read and act on reports.
Avoid overly frequent or granular reports that generate noise and reduce responsiveness. Daily reporting on metrics with natural variability creates false alarms and desensitizes teams to genuine performance changes. Similarly, reports packed with dozens of metrics dilute focus from the vital few indicators that truly matter. More reporting doesn't equal better insights when it overwhelms analytical capacity.
| Report Type | Frequency | Pros | Cons | Best For |
|---|---|---|---|---|
| Weekly | Every 7 days | Enables rapid optimization, catches issues early | Can show noise from daily variance, time-intensive | Active paid campaigns, A/B testing |
| Monthly | Every 30 days | Strategic perspective, clear trends, efficient use of time | Slower response to problems, may miss optimization windows | Content marketing, brand campaigns, executive overviews |
| Quarterly | Every 90 days | Big-picture strategy assessment, seasonal patterns | Too slow for tactical decisions, delayed problem detection | Strategic planning, board reporting |
Pro Tip: Start with stakeholder needs to set frequency and customization. Ask decision-makers what questions they need answered and how quickly they need to act on insights. Let these answers guide your reporting structure rather than defaulting to arbitrary schedules.
Understanding performance marketing vs traditional marketing helps set appropriate reporting expectations. Performance marketing demands more frequent, granular reporting because optimization happens continuously. Traditional brand marketing accepts longer feedback loops. Match your reporting rhythm to your marketing approach.
The marketing reporting guide emphasizes that sustainable reporting practices balance thoroughness with efficiency. Automated dashboards handle routine metric tracking, freeing analysts to focus on interpretation and recommendation development where human judgment adds unique value.
Case studies: SMB success through effective marketing reporting
Small businesses have increased lead generation and ROI by applying targeted marketing reporting that reveals optimization opportunities and guides resource allocation. One health and wellness SMB implemented weekly campaign reporting segmented by audience demographic and ad creative variation. This discipline revealed that video ads targeting women aged 35 to 50 generated leads at half the cost of static image ads targeting broader audiences. Reallocating budget based on this insight improved overall campaign efficiency by 22% within six weeks.
An SMB improved lead generation by 15% in one quarter through focused social media campaigns enabled by data-driven reporting. The business had been running Facebook and Instagram ads with minimal performance tracking beyond basic metrics like reach and engagement. After implementing structured weekly reporting that tracked cost per lead and lead-to-customer conversion rates, they discovered their Instagram campaigns generated cheaper but lower-quality leads while Facebook delivered fewer but higher-converting prospects. Adjusting budget allocation and creative strategy based on these insights produced the documented improvement.
Examples of digital ad campaigns for growth demonstrate how reporting discipline separates successful initiatives from wasteful spending. A retail SMB selling specialty products launched Google Shopping campaigns with minimal tracking. Initial results seemed acceptable based on click volume. Implementing detailed conversion tracking and profitability reporting revealed that certain product categories generated sales but negative margins after ad costs. Pausing unprofitable campaigns and scaling profitable ones transformed overall ROI from marginally positive to strongly profitable.
Success involves actionable insights driving real campaign adjustments rather than reports that get filed and forgotten. The common thread across successful SMB reporting initiatives is leadership commitment to acting on data even when insights challenge existing assumptions or require uncomfortable changes. Reports only create value when someone with authority reads them, understands the implications, and authorizes necessary optimizations.
Key success factors for SMB reporting initiatives:
- Executive sponsorship ensuring reports influence actual decisions
- Clear performance benchmarks established before campaigns launch
- Regular review meetings where stakeholders discuss insights and authorize changes
- Integration between reporting tools and campaign management platforms
- Willingness to pause underperforming initiatives rather than defending sunk costs
- Celebration of optimization wins to reinforce data-driven culture
These examples prove that reporting excellence doesn't require enterprise budgets or massive teams. Small businesses with limited resources often achieve outsized results by focusing relentlessly on measuring what matters and optimizing based on evidence rather than assumptions.
Enhance your marketing impact with expert reporting support
Mastering marketing reporting transforms data overwhelm into strategic advantage, but building this capability internally demands time and expertise many SMBs lack. Partnering with specialists who live and breathe performance marketing accelerates your journey from confusion to clarity. Expert Google Ads management and Meta ads management services deliver not just campaign execution but the structured reporting frameworks that turn ad spend into measurable growth.
Professional performance marketing partners bring proven reporting templates, analytics expertise, and optimization discipline honed across hundreds of campaigns. They implement tracking systems that capture the metrics that actually matter for your business model, create stakeholder-specific dashboards that drive decisions, and provide ongoing analysis that identifies opportunities you might miss. This support translates complex data into clear narratives about what's working, what needs adjustment, and where to invest next for maximum return.
Frequently asked questions
What is the primary purpose of marketing reporting?
Marketing reporting's primary purpose is transforming raw campaign data into actionable insights that guide strategic decisions and tactical optimizations. Effective reports reveal which marketing investments generate returns, where resources are being wasted, and what adjustments will improve performance. This enables smarter budget allocation and evidence-based strategy refinement.
How often should SMBs generate marketing reports?
Reporting frequency should align with decision-making rhythms and campaign velocity. Weekly reports suit active paid advertising campaigns requiring rapid optimization, while monthly reports work better for strategic overviews and slower-moving initiatives. The key is matching reporting cadence to how quickly you need to act on insights.
What are common misconceptions about marketing reporting?
Many believe more data automatically improves decisions, but volume without interpretation creates confusion rather than clarity. Another misconception is that reports should capture every available metric, when focused reporting on vital few KPIs proves more actionable. Reports misaligned with decision cycles waste time without enabling better choices.
What key metrics should SMBs track in their marketing reports?
Critical metrics depend on business goals but typically include cost per lead, conversion rates, return on ad spend, customer acquisition cost, and revenue attribution by channel. These connect marketing activity to business outcomes rather than vanity metrics. Align KPIs with stakeholder needs so executives see ROI while managers get tactical performance data.
Recommended
- Performance Marketing Team | Multi‑Channel Paid Ads
- Performance Marketing Team | Multi‑Channel Paid Ads
- Performance Marketing Team | Multi‑Channel Paid Ads
- Performance Marketing Team | Multi‑Channel Paid Ads
- How Print Supports Marketing Success for Businesses
- Role of Merch in Promotion: Boosting Local Brand Impact